Performance Level
What Performance Level should my Machine be Engineered to?
Risk Graph
The following chart should be used to dertermine the required Performance level.

Risk graph Example 1 Emergency-stop-function

In the above example the machine has been considered to be able to do non reversing injury or death to personel operating the machine if it fails to stop so the S2 path has been chosen.
It is considered that the frequency of this type of operation is not a normal operation of the machine and so the F1 path has been chosen.
There are guidlines in the standards that determine whether it is possible to avoid the hazard. The speed would be an example of this. If the machine is safely limited to a slow speed when operators pass a light curtain for example then the hazard is avoidable and P1 path is chosen.
This requires a Performance level of c to be reached.
CASE STUDIES
August 2018
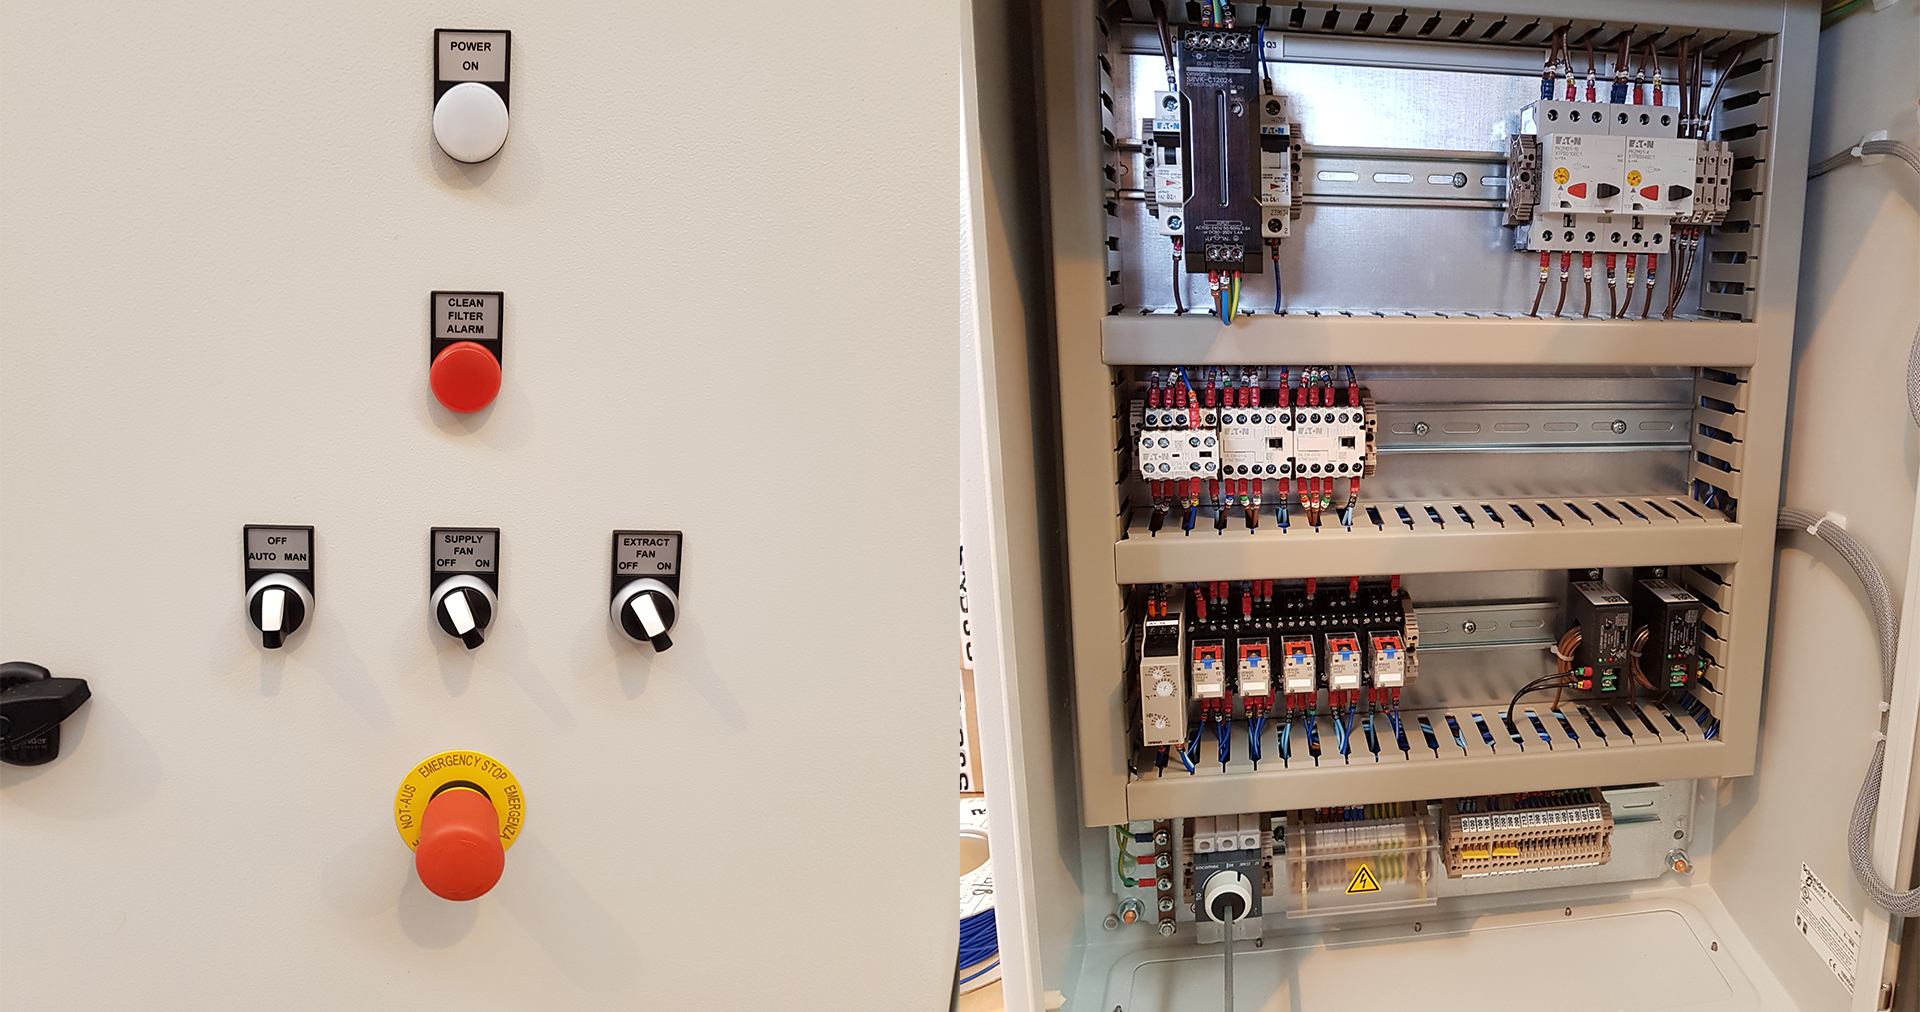
Ventilation System
Project Description APS have just designed and built some new [...]
April 2018
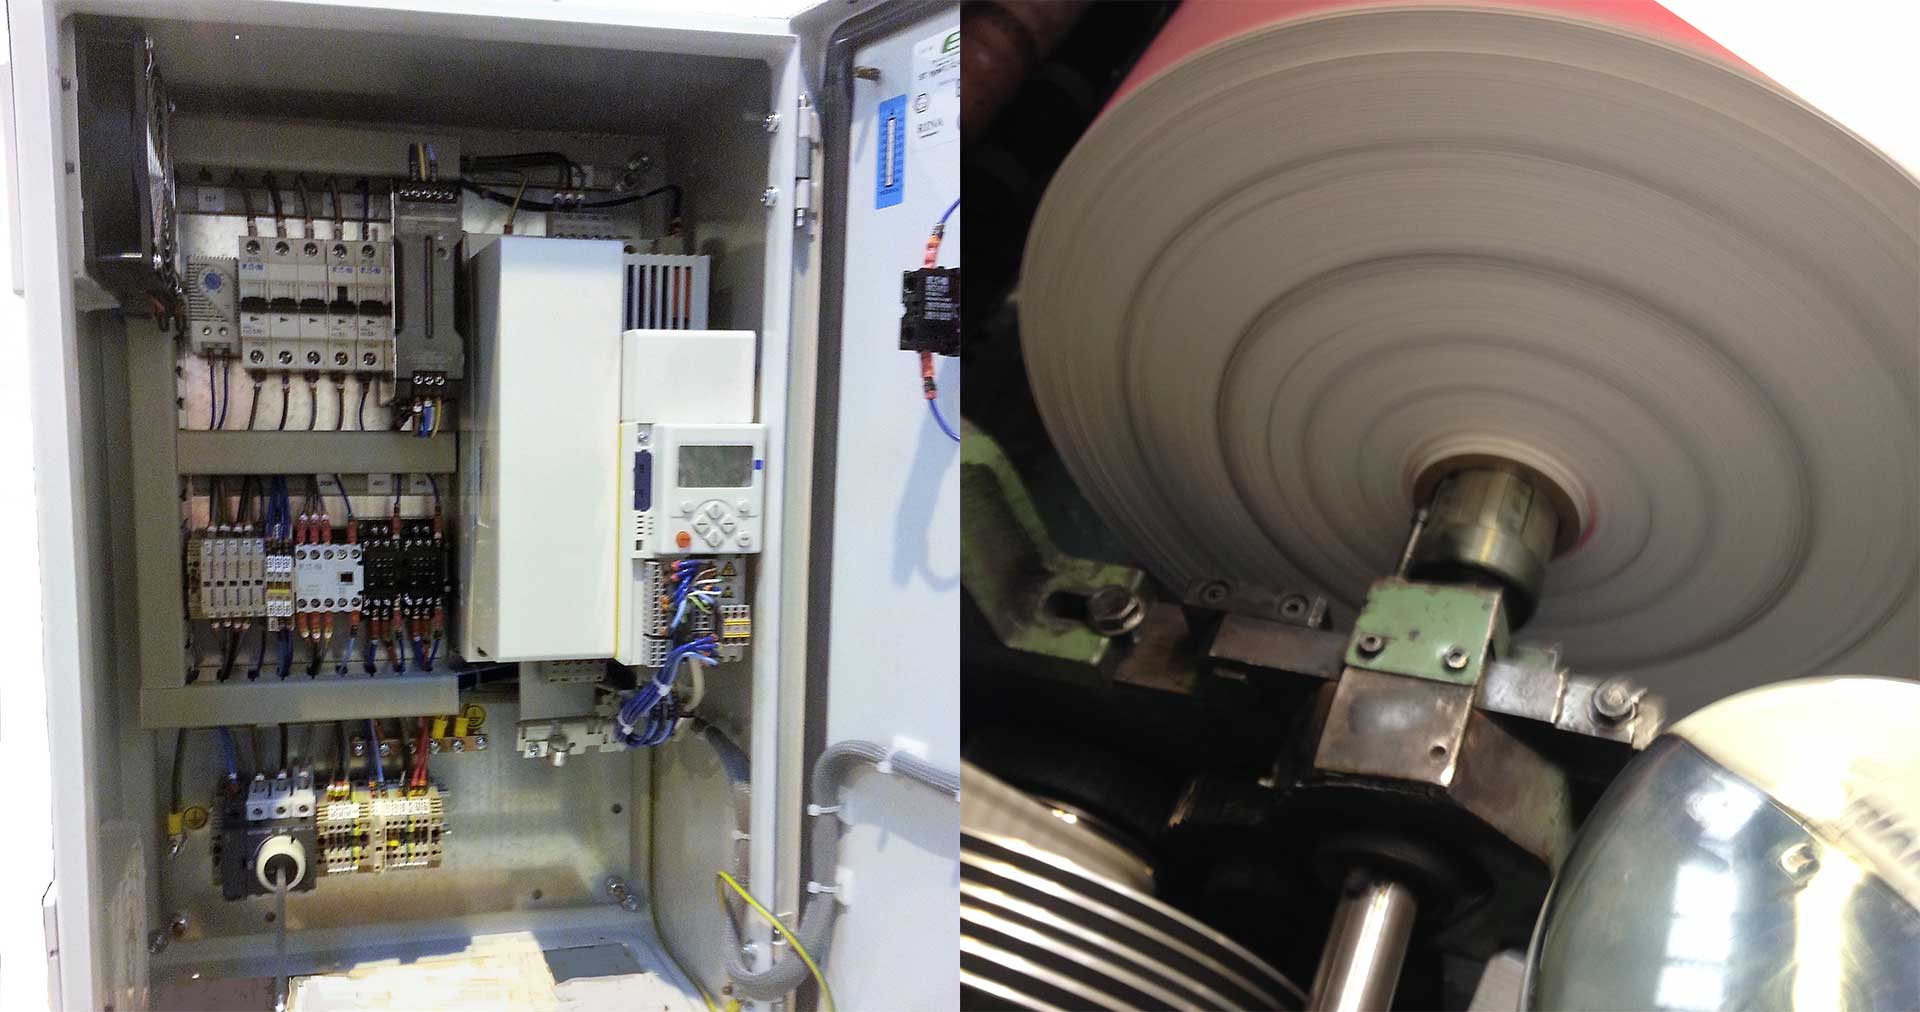
Winding Control
Project Description David Emmett, the owner of British Paper Coils [...]
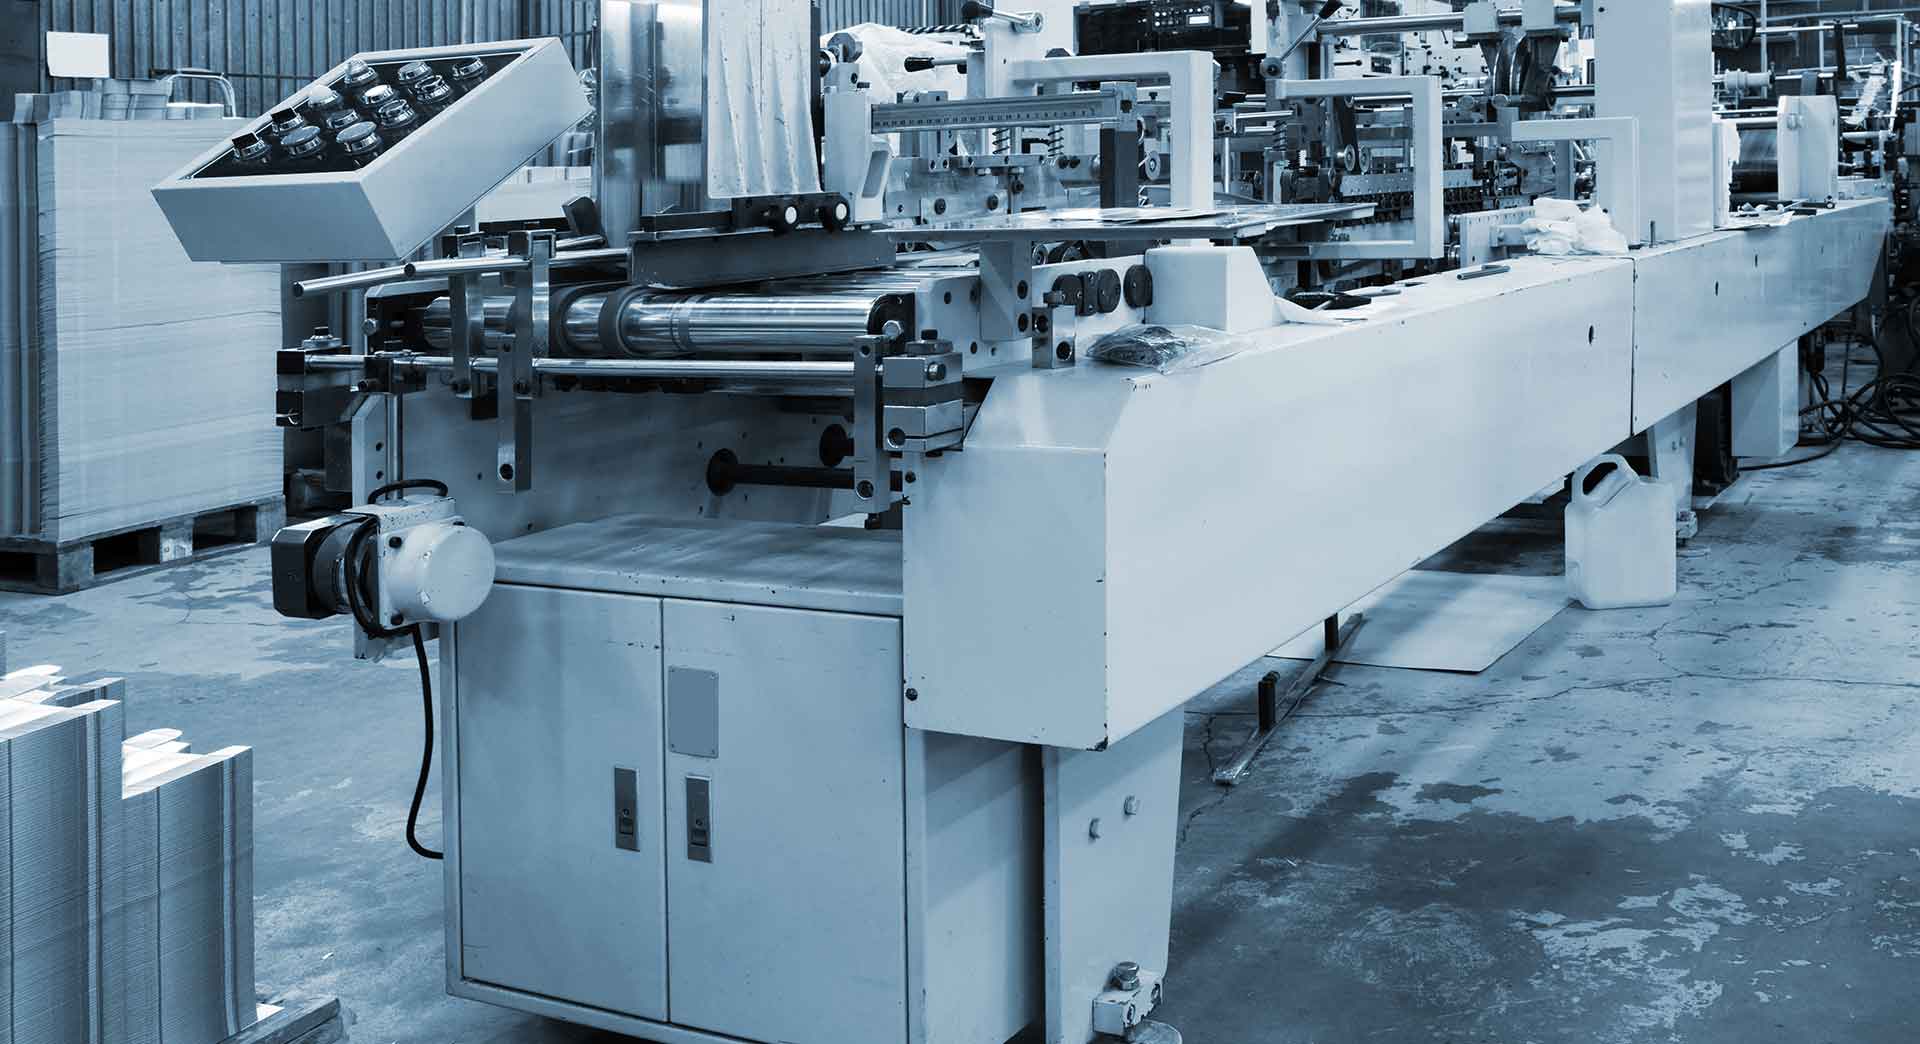
PRINTING INDUSTRY
Printing Industry APS (Automation Products and Systems) have provided systems [...]